2 Importing Dataset and Modelling
Power BI can connect to a whole range of data sources from Excel sheets and local databases to several Cloud services. Currently, over 60 different cloud services have specific connectors to help you connect with generic sources through XML, CSV, text, and ODBC.
Let us start connecting to one of the data sources. For today we will be working on the gap_minder_map.csv file.
2.1 Importing data into Power BI Desktop
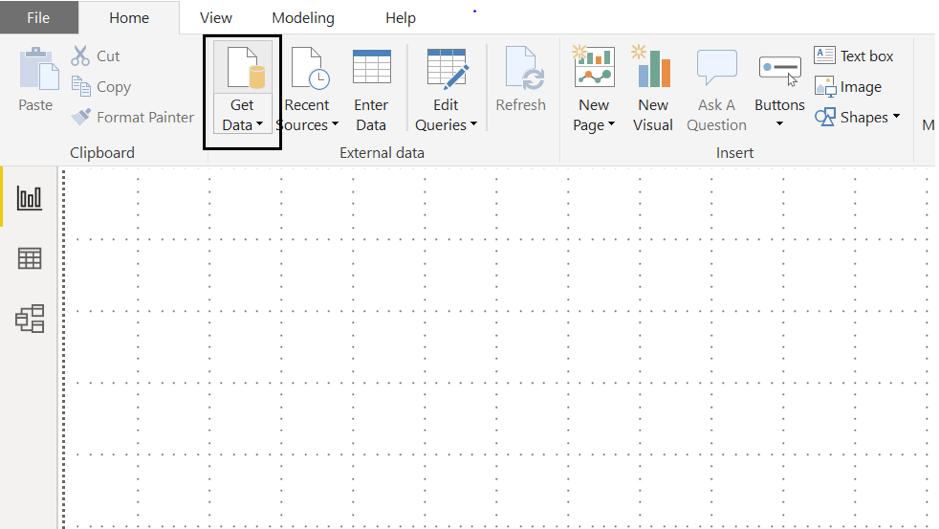
Power BI Desktop has a Get Data button from the ribbon on the Home tab. In Power BI, there are all sorts of different data sources available. Select a source to establish a connection. Depending on your selection, you will be asked to find the source on your computer or network, or be prompted to sign in to a service to authenticate your request.
As our first step to import the dataset/file into Power BI, we click on the Get Data icon on the ribbon of Home tab.
Once we select this, we go ahead and select the CSV option under the file subheading.
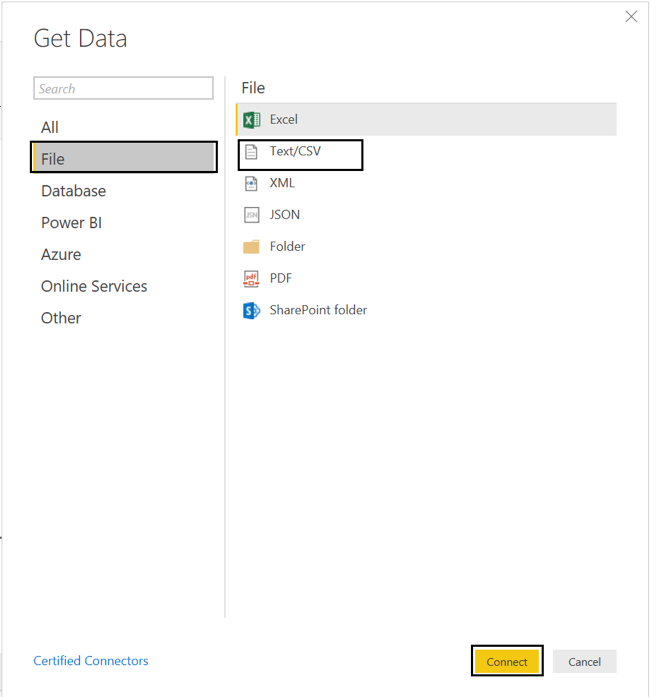
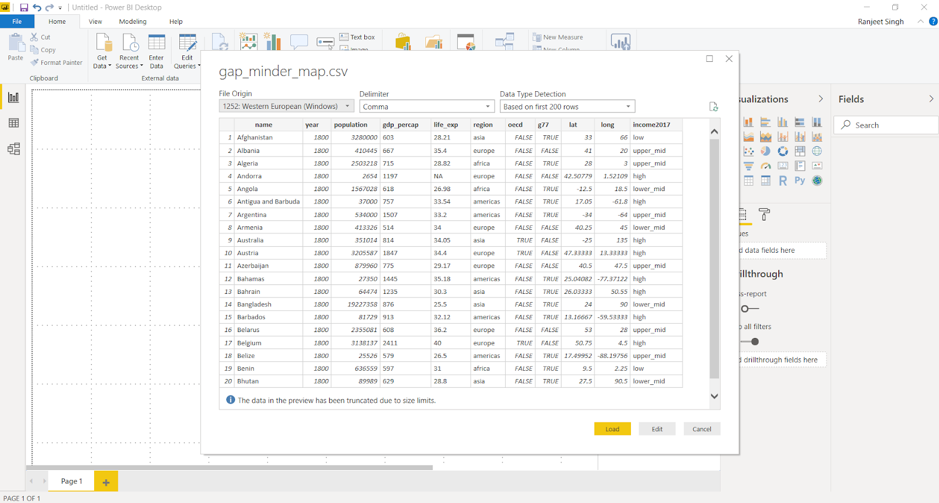
Then browse the file and select the necessary CSV file. Press on Connect to have a quick preview of the file. Once we click on Load, Power BI will successfully import the file. Any errors will then pop up ready to be analysed and fixed.
If there are any errors in the data load, select View errors to check any detected errors. Alternatively, close the pop up and click Edit queries to check for any errors. This will query and list the errors in the data.
2.2 Dealing with errors
2.2.1 Checking for automatically detected errors
Once queried, any detected errors will be displayed. Clicking on these errors will provide a brief description on what might have gone wrong. There will be some errors showing up in your data, click on the errors to see what has caused the issue.
2.2.2 Changing data type of column
One of the most common errors is the detection of the datatype of a particular column. While loading the data, Power BI automatically assigns a column type based on the first lines of data. This can cause errors or other problems if the automated data type is not suited for that column. You may need to change data types of the columns to a relevant type for your data model.
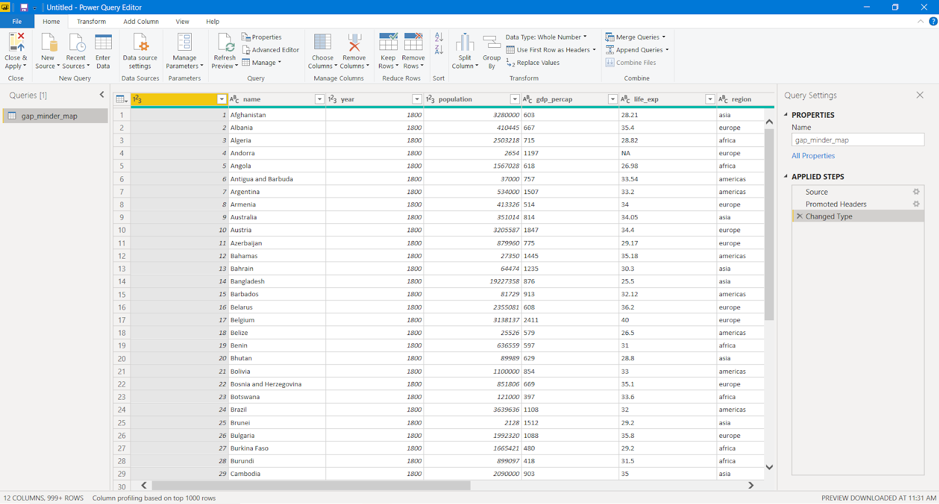
Any changes to the data needs to be done under the Data file listed under Other Queries.
The life_exp column is displaying as text data. This is a problem as we may want to do numerical calculations with this data. We should change this to a numerical data type.
- Select the gap-minder file.
- Right click on top of the column and select Change type.
- Change to Decimal Number.
You can replace a current step in the query with Replace current step or add a new step to the query with Add new step.
- Click Add new step.
Once necessary changes are made, it is important to refresh and check if the change was applied. We can do this by clicking on the Refresh Preview button on the ribbon.
You will notice that this has created errors due to several cells containing N/A.
2.2.3 Replacing values
Data can have erroneous and missing values for a number of reasons. Missing data is represented as null in the data. You will often need to deal with such values and fix or remove them.
You can view the data in the Data section on the left sidebar. By applying a filter to a particular column, the null values can be analysed. To replace any null values, go to the Query Editor and use the Replace values option in the Transform tab. You can also remove error values by right-clicking a column and selecting the Remove errors option.
Look in Errors in gap-minder in the Query Errors folder. You will notice that all the years for 1820 have a whitespace in it that is causing an error.
- Return to the gap-minder data .
- Right click the
yearcolumn and select Replace errors. - Replace this with
1820.
This will replace all errors with the value 1820. In this case this works as only one value is causing an issue. You can use Replace values to find and replace several values.
Challenge 1: Replace missing values
Use the Remove errors option on the life_exp column to remove the error values caused by the blanks.
Use the Replace values option on the gdp_percap column to replace the blank values.
2.2.4 Final notes on dealing with errors
Replacing error and missing values is not always a direct operation. Most of the time, these values must be carefully analyzed and replacement values need to be computed based on several factors. While this can be done with in Power BI, this is not a key capability of Power BI. Furthermore these changes do not affect the source data set. These changes are actions that Power BI takes whenever you load in that dataset.
You may have noticed errors in the OECD column. If you tried to fix these with a Replace values option you will find that this does not work. This is because Power BI has automatically made this column a Boolean column and is intentionally ignore this values as they produce errors. To get around this you would have to change the column to a text column, find and replace the values, and then change the column back to boolean. This are additional steps that Power BI will be made to run everytime you load this data and is inefficient.
Cleaning up the source data as much as possible in the early stages will save you problems in the future, this is true for any data analysis. The best approach is to clean up and eliminate errors from your data before you import into Power BI. This will minimise the amount of actions that Power BI takes and speeds up the loading process. This cleaning process may take several iterations as you work with Power BI and the data and uncover more inaccuracies.
Power BI does ignore blank and error values when it comes to analysis and visualisation but this may not always be the best approach.
Cancel the last two steps in the Applied steps by clicking on the red crossmark right next to Removed Errors and Replaced Value.
2.3 ‘Applied steps’ in modelling data
2.3.1 Renaming columns
Columns from raw data can be difficult to read or meaningless. Renaming the columns in your query to a meaningful name will make it easier for you and your audience to understand your data. This will often save you trouble in the future when it comes to working and presenting the data.
There are two ways to rename the columns in Power BI. Right-clicking on the header of the column gives you a menu of functions that you can do to the column. Select Rename to rename the column. You can also click on the column and then click on the Transform tab, from here you are presented a variety of transformation functions for the column. From here you can click on Rename.
- Right-click on the
namecolumn header, click on Rename and rename the column toCountry. - Click on the header for
life_exp. Click on the Transform tab and click rename. Rename the column toLife expectancy.
2.3.2 Adding and removing columns
2.3.2.1 Removing columns
Often when dealing with raw data you will find columns that are meaningless or unsuitable for your analysis. You can remove these columns in Query to eliminate clutter and streamline the data set making it easier to work with.
There are two ways to remove columns in Power BI. As in renaming a column, you can right-click the header, which will present a menu with the option to Remove. You can also click on the column, click on the Home tab and then click Remove Columns.
We will not be using the g77 information.
- Right-click on the
g77column header, click on Remove
2.3.2.2 Adding columns
Just as you would remove unsuitable data from your queries, you may need to add new columns to your data. There are a variety of options in Power BI to add different columns. Click on the Add Column tab to see the ways you can add a column.
- Click on
gdp_percap, click on the Add Column tab, click duplicate to create a separate column to run calculations on.
Challenge 2: Add
Perform a simple mathematical operation and add this as a new column.
Let’s say you want to calculate Total Gross Domestic Products (GDP) per country. As Total GDP = Population x GDP per capita, using the new gdp_percap column you created in the previous example, use Custom Column to create a new column with Total GDP per country.
2.3.4 Refreshing data ready for analysis
Always refresh your data when you are ready to do your analysis and visualisation. Clicking the Refresh option will refresh the data and rerun all your queries. This will show any issues or errors with your data or your queries and ensure that all the data is up to date and ready for analysis.
Once all the required changes are done, select Close & Apply going back to the main Power BI Desktop interface.